7 Quality Engineering Tools You Need

Andrew Bank
Quality has to be built into every stage of product development. Learn which tools are essential for every quality engineer.
Quality has to be built into every stage of product development. Learn which tools are essential for every quality engineer.
In product development, quality isn’t optional—it’s foundational. Getting it right the first time saves time and money, and preserves reputation.
The first step to achieving quality engineering is to invest in tools that help you detect problems early, identify root causes, and implement improvements quickly and efficiently.
Here are seven tools that we recommend and use at Treetown Tech:
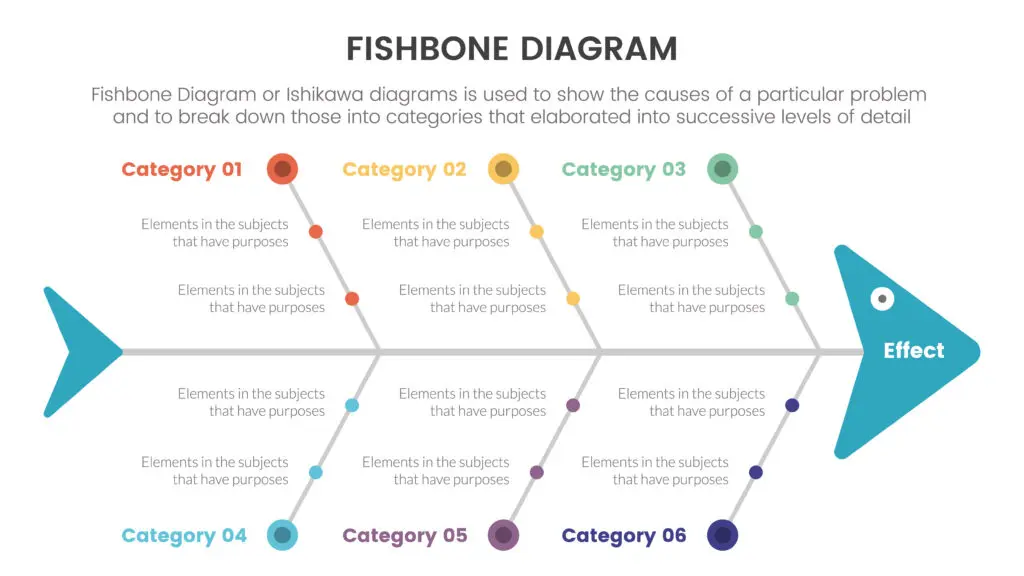
This visual tool maps cause-and-effect relationships to pinpoint the root causes of quality issues. It categorizes potential defect sources into areas like manpower, machines, methods, materials, measurements, and environment—simplifying complex problem analysis.
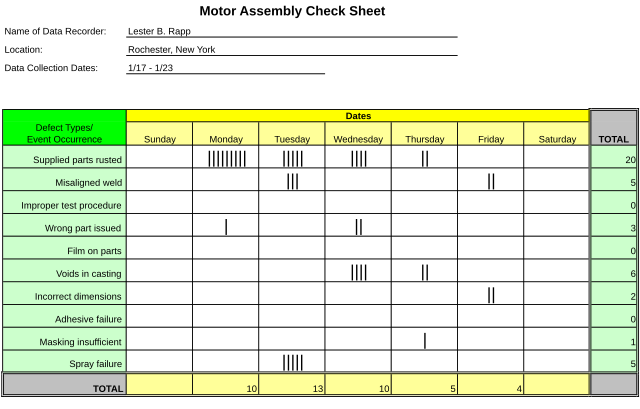
Check sheets serve as foundational data collection forms that log defect occurrences or process deviations. They help reveal patterns over time, guiding process improvements and preventive maintenance, and they are especially useful in high-mix or short-run production settings.

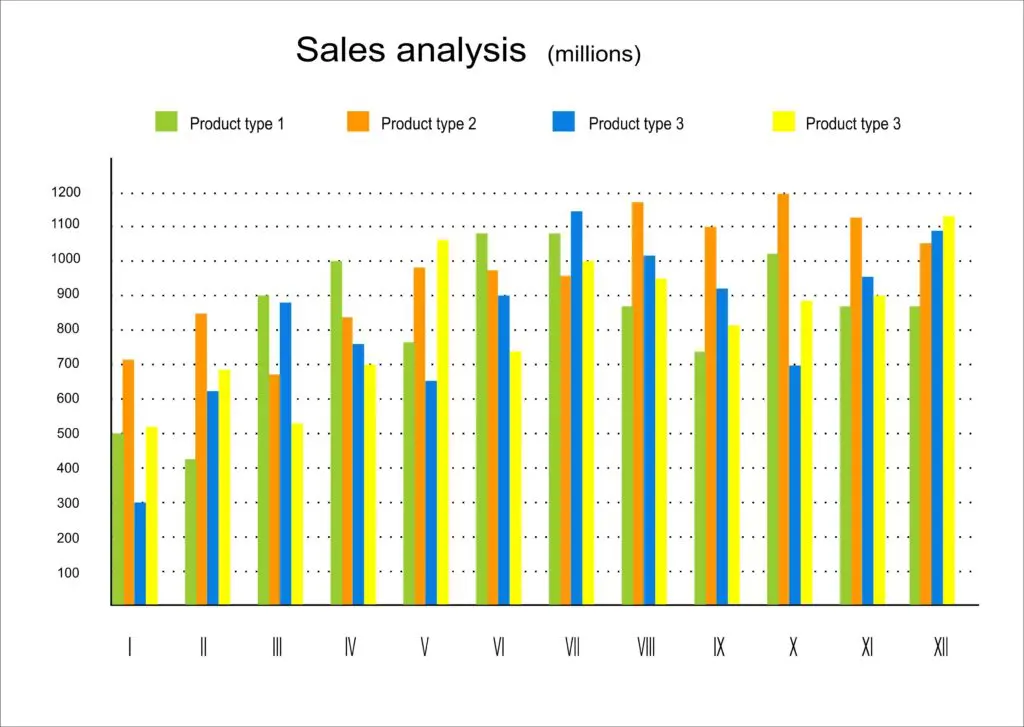
Based on the Pareto Principle (80/20 rule), this bar chart highlights the most frequent defects or failures. By focusing on the “vital few” issues, quality engineers prioritize their efforts to have the greatest impact.
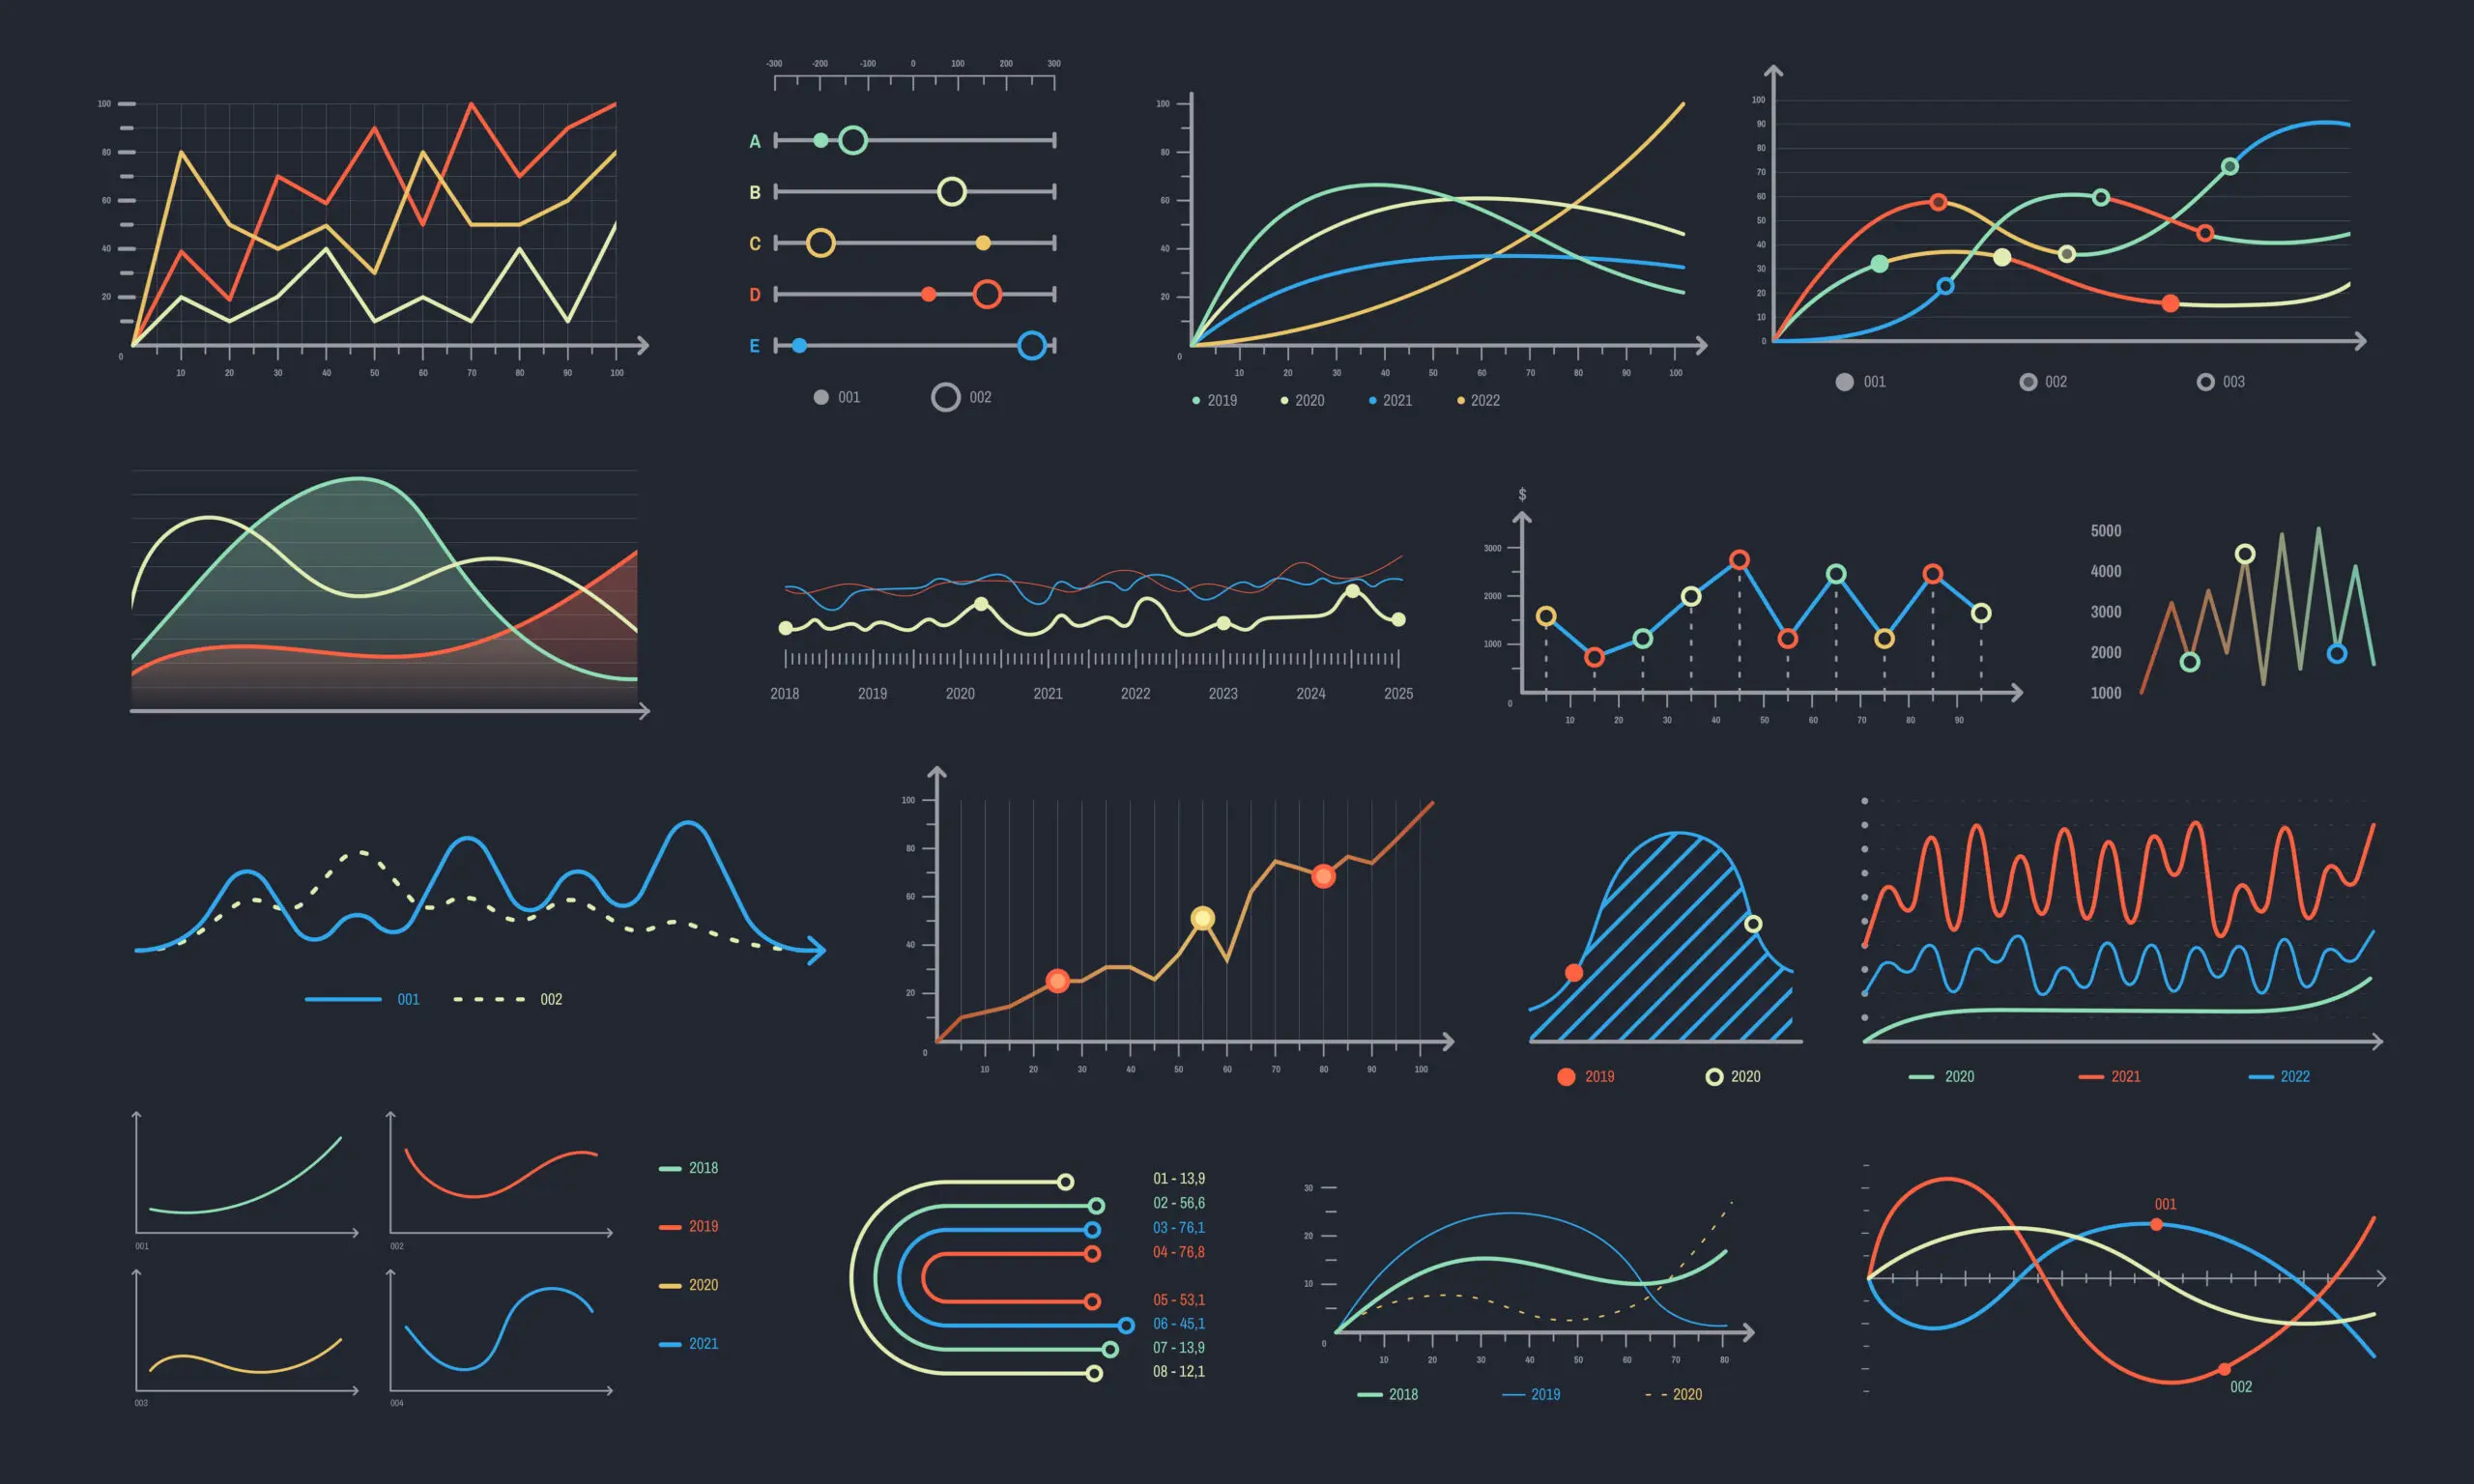
Understanding data distribution is key to selecting appropriate statistical methods. Tools like histograms, box plots, and normality tests reveal if data follow a normal curve or require non-parametric techniques, ensuring analysis accuracy.

Scatter plots display the relationship between two variables, helping identify trends, correlations, or unusual variations. While they do not prove causation, they are invaluable for hypothesis generation and regression analysis.
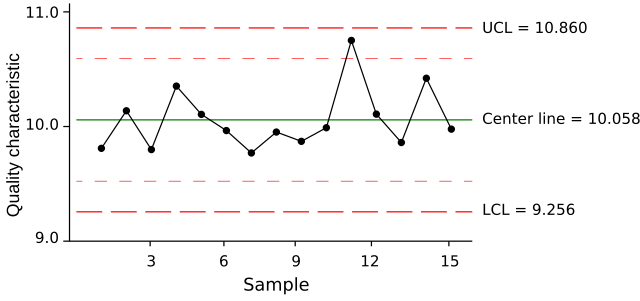
Control charts are the cornerstone of Statistical Process Control (SPC). They track performance over time, allowing engineers to detect special-cause variation. They also keep processes within predefined control limits, which is critical for maintaining consistent quality.
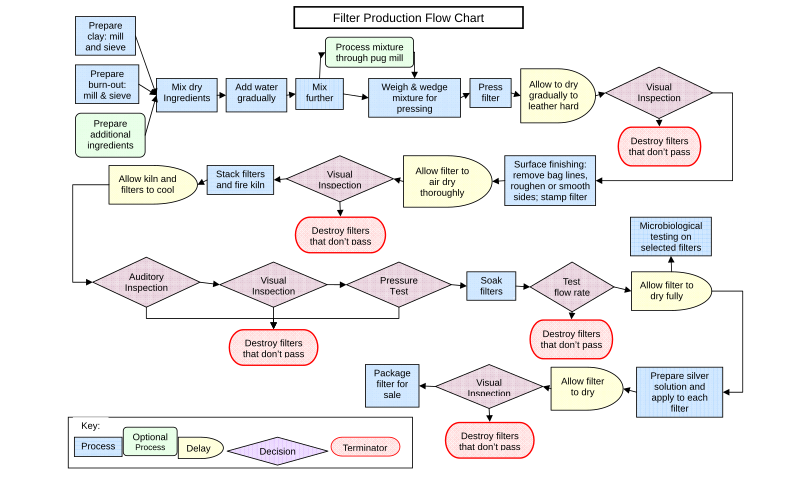
Flow charts visually map processes, outlining steps, roles, and decision points. They help teams identify redundancies, bottlenecks, and quality gates, allowing streamlined operations and risk reduction.
Quality isn’t something you verify at the end of a process—it’s something you have to build into every stage of the product lifecycle, from early prototyping to full-scale manufacturing. By prioritizing root-cause analysis, data-driven decision-making, and robust process control, you can design better products faster.
Visit our website for more resources, or contact our engineering consultants today if you need help building quality into your next project.
You have the vision. We have the team and expertise to get it built. Let's collaborate to innovate, problem-solve, and de-risk every step of the way.